How to Calculate Standard deviation, Definition, Formula And Types
Here we learn about How to Calculate Standard deviation in details. let’s start
Definition: Standard deviation is a statistical measure of the amount of variation or dispersion of a set of values.
A standard deviation table can be useful for identifying outliers, understanding the distribution of the data, and making inferences about a population based on a sample.
Standard Deviation Calculator
Standard Deviation Calculator
Standard deviation table
The standard deviation is a measure of the spread or dispersion of a set of data. A table of standard deviations can be used to understand the distribution of the data and to make statistical inferences. The table typically includes the following information:
- Mean: The average of the data set.
- Standard deviation: The measure of the spread of the data set.
- Data points: The individual observations in the data set.
- Z-scores: The number of standard deviations each data point is from the mean.
- Percentiles: The values that divide the data set into 100 equal parts.
Formula: The formula for standard deviation is:
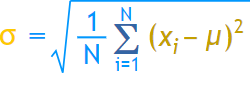
This is the formula for Standard Deviation:
SD = √(Σ(X - μ)^2 / N)
where X is each value in the dataset, μ is the mean of the dataset, N is the number of values in the dataset, and Σ represents the sum of.
Standard deviation formula
The standard deviation formula for a sample of data is:
sqrt( Σ (X-x̄)^2 / (n-1) )
where X is a value in the sample, x̄ is the sample mean, n is the number of values in the sample, and Σ denotes the sum of all the values.
For a population of data, the standard deviation formula is:
sqrt( Σ (X-μ)^2 / N)
where X is a value in the population, μ is the population mean, N is the number of values in the population, and Σ denotes the sum of all the values.
How to calculate Standard deviation:
- Calculate the mean (μ) of the data set.
- Subtract each value from the mean (X - μ)
- Square each result from step 2.
- Sum up all the squared results.
- Divide the result from step 4 by the number of data points in the dataset (N).
- Take the square root of the result from step 5 to find the standard deviation.
Need: Standard deviation is useful in many applications, including in finance to measure the risk of an investment, in medicine to describe the spread of disease, and in psychology to describe the range of individual responses to a test.
Example:
Consider a data set of 5 values: 2, 4, 4, 4, 5.
- Mean (μ) = (2 + 4 + 4 + 4 + 5) / 5 = 4
- X - μ = -2, 0, 0, 0, 1
- (X - μ)^2 = 4, 0, 0, 0, 1
- Σ(X - μ)^2 = 5
- SD = √(5 / 5) = √(1) = 1
The standard deviation of this data set is 1.
There are two types of standard deviation:
- Population Standard Deviation: The standard deviation of all the values in a population.
- Sample Standard Deviation: The standard deviation of a sample taken from a population.
Population and Sample Standard Deviation Calculator
Standard Deviation Calculator
Population Standard Deviation:
- Definition: The square root of the average of the squared differences between each value in a population and the mean of that population.
- Formula: sqrt( Σ (X-μ)^2 / N) where X is a value in the population, μ is the population mean, N is the number of values in the population, and Σ denotes the sum of all the values.
- Importance: The population standard deviation provides a measure of the variability or spread of a population. It gives an idea of how spread out the values in a population are from its mean.
- Example: Consider a population of heights of 10 people, where the heights are 160, 165, 170, 170, 175, 180, 182, 185, 190, and 195 cm. The population mean is 176 cm and the population standard deviation is 8.25 cm.